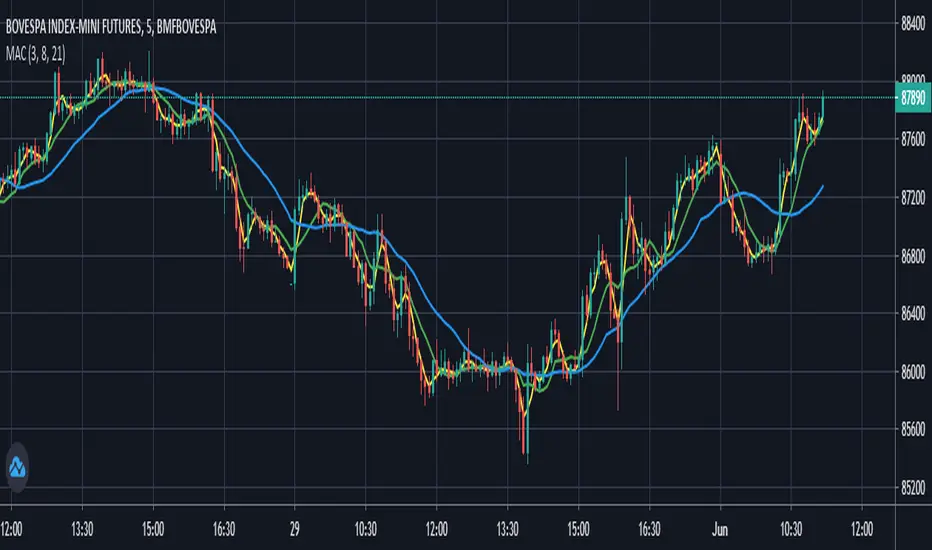
Moving Averages Convergence (Agulhada do Didi)The script is based on a strategy developed by Odir “Didi” Aguiar called “Agulhada do Didi”.
It consists in the use of 3 moving averages:
SMA 3
SMA 8
SMA 21
Strategy:
When the averages come together, preferably they pass through a candle, there is a signal. The crossing of the short average (3) with the long average (21) provides us with a confirma-tion of the entry.
Buy:
The average of 3 periods comes out on top, 8 goes in the middle and 21 goes down.
Sell:
Average of 21 periods comes out on top, 8 in the middle and 3 down.
Search in scripts for "the script"
Lyiness_Naked-Trading-ProjectThe script is based on the Naked Trading Strategy.
It is based on 2 time periods, by which one is able to interpret a good entry.
You can change the 2 periods in the menu to identify a good result depending on the length of the trade.
In set mode, it displays the highs and lows of the day.
The blue thin line is set to the weeks high and low. You can adjust this in the menu to the desired option.
You can enter in the option Kanal_Periode1 / 2:
A number that reflects the minutes. (1-.....)
D = day
W = weeks
M = month

SuperRadu Trade Assistant v0.2The script uses higher and lower swings to generate the resistance(red) and support (green) also the orange color represents the crossunder midline.
It will generate a new sell or buy entry suggestion when the price reject the resistance or the support and the median line it will confirm the trend direction between low high swings in this way you are able to make a better decisions and to place stop or take profits on a real targets.

Footprint Imbalance Reversal ZonesThe script detects blowouts and displays buy and sell volume as levels.
Green lines = bullish zones (potential support / buying pressure)
Red lines = bearish zones (potential resistance / selling pressure)
---------------
Trade ideas:
---------------
Price approaching a green zone → potential bounce/support.
Price approaching a red zone → potential rejection/resistance.
Combine with other indicators or price action for confirmation.
-----------------
Configuration
-----------------
Inputs:
Imbalance Threshold (%) → higher = only very strong imbalances trigger zones
Bars to form cluster → number of consecutive imbalance bars needed
Zone Extend Bars → how far each zone line extends into the future
Minimum bar volume → ignore low-volume bars for cleaner zones
Use tick-rule volume estimate → leave true if no real bid/ask data
Max saved zones → max number of zones stored (oldest removed if exceeded)
------
Tips
------
Best used on intraday or short-term charts where volume imbalances are meaningful.
Adjust Minimum bar volume to filter out low-volume noise.
Combine with candlestick patterns, RSI, or moving averages for higher-probability trades.
For long-term charts, consider increasing Bars to form cluster to capture stronger levels.
Combine with price action, candlestick patterns, or other indicators for better trade signals.

Algo & Dark Pool Activity - Find Hidden LiquidityThe script is designed to highlight potential algorithmic buying pressure and dark pool accumulation proxies on a TradingView chart. It overlays signals directly on price bars so you can visually spot when unusual activity may be occurring.


Previous Day/Week High and Low • Ahmed SiddiquiThe script shows Previous Day's Candle High and Low & Previous Week's Candle High and Low which updates automatically everyday and every week. There are few more modification will be done in next versions.

Candle High/Low RaysThe script identifies a specific candle at a time you define and draws two horizontal rays:
High Ray - Extends from the high of that candle indefinitely to the right
Low Ray - Extends from the low of that candle indefinitely to the right
These rays show the last 3 days of midday candle levels on your chart, helping you identify important support/resistance levels.

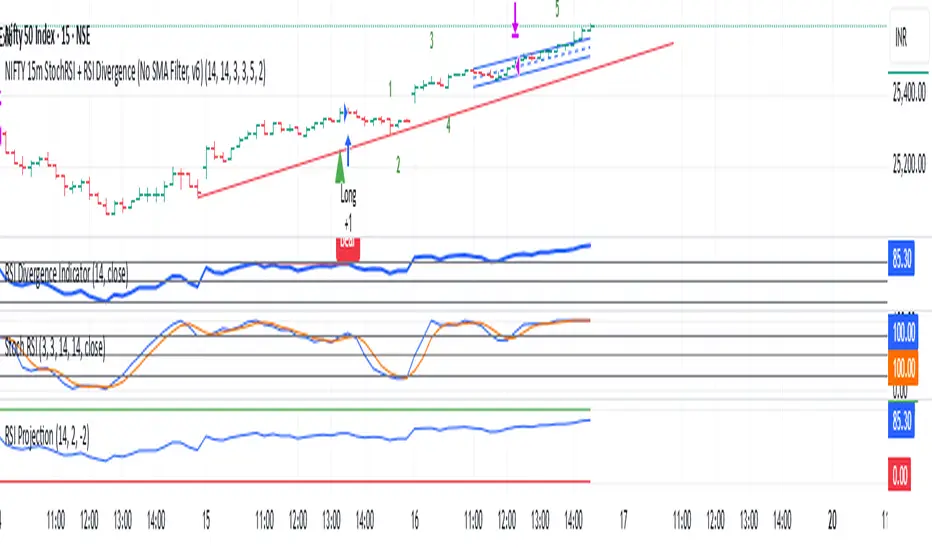
Monster PerfectionThe script tracks confluence between Stochastic and RSI. It marks candles where the Stochastic crosses in extreme zones while the RSI shows divergence with price. These signals point to possible short term reversals.

XAUUSD Fisher Transform Dashboard — Trend & Momentum InsightsThe script offers an educational visualization of trend and momentum on XAUUSD by combining the Fisher Transform with EMA direction. It plots momentum shifts, trend alignment, and includes a concise dashboard showing trend bias, the latest crossover event, and customizable percentage-based reference markers.
This tool is for market analysis and study purposes only and does not provide trading advice.

Breakout an Reversal Signal Detector with Colored in Bar TrendsThe script detects breakouts and/or reversals: when candles close outside the recent period high or low, it prompts a signal, indicating a change in market trend.
You can customize the bar color to indicate trending phases.
It can be used effectively to identify both breakouts and reversals, making it a versatile tool for trend and reversal analysis.
Simple yet effective.
Enjoy!

Psychological Levels + Retest The script detects key round-number psychological levels such as 00, 50, and 100 zones based on the pair’s pip structure.
It then monitors price behavior around these zones using customizable buffers to highlight reaction areas.
When price breaks above a major or minor psychological level while trading above the 200 EMA, the indicator tracks for a retest confirmation. Once the required number of touches occurs within the defined buffer, the indicator marks the retest area and can trigger alerts for trade opportunities.

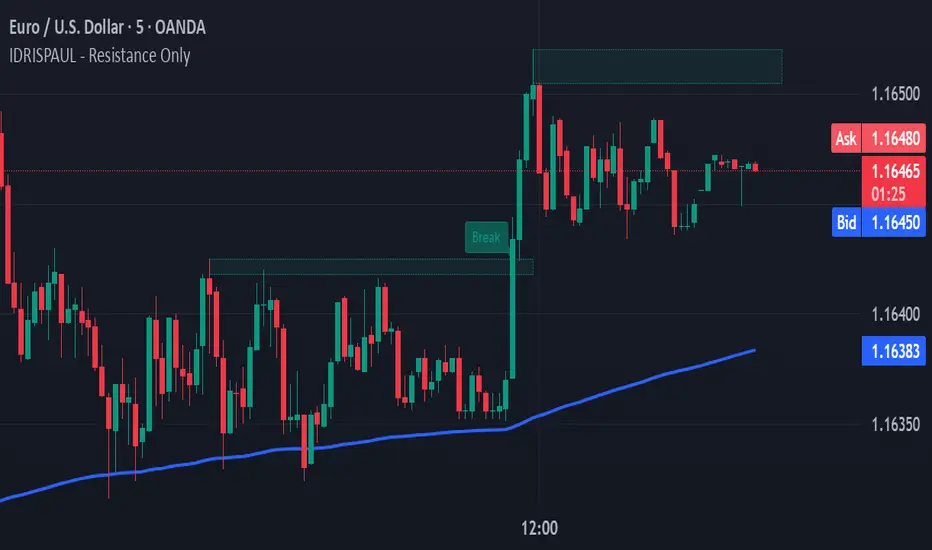
IDRISPAUL - Resistance OnlyThe script continuously scans recent price action to identify pivot highs that qualify as potential resistance zones. Once a resistance level is detected, the indicator:
Draws a resistance box around the identified zone.
Monitors for breakouts above that resistance.
Tracks potential retests and confirms valid retests when price action revisits the broken level.
Triggers alerts for each event: new resistance, breakout, potential retest, and confirmed retest.
All levels and labels automatically update as the chart evolves
Correlation Table 5хThe script allows you to determine the correlation in real time, which makes it possible to effectively select trading pairs.

Vortag High/LowThe script displays the previous day's high/low during trading hours from 9:30 to 16:00 EST. This gives us a clean chart.

Scenario Screener — Consolidation → Bullish SetupThe script combines multiple indicators to filter out false signals and only highlight strong conditions:
Consolidation Check
Uses ATR % of price → filters out stocks in tight ranges.
Uses Choppiness Index → confirms sideways/non-trending behavior.
Momentum Shift (Bullish Bias)
MACD Histogram > 0 → bullish momentum starting.
RSI between 55–70 → strength without being overbought.
Stochastic %K & %D > 70 → confirms strong momentum.
Volume & Accumulation
Chaikin Money Flow (CMF > 0) → buying pressure.
Chaikin Oscillator > 0 (debug only) → accumulation phase.
Trend Direction
+DI > -DI (from DMI) → buyers stronger than sellers.
ADX between 18–40 → healthy trend strength (not too weak, not overheated).
Breakout Filter (Optional)
If enabled, requires price to cross above 20 SMA before signal confirmation.
📈 Outputs
✅ Green label (“MATCH”) below the bar when all bullish conditions align.
✅ Background highlight (light green) when signal appears.
✅ Info Table (top-right) summarizing key values:
Signal = True/False
MACD, CMF, Chaikin values

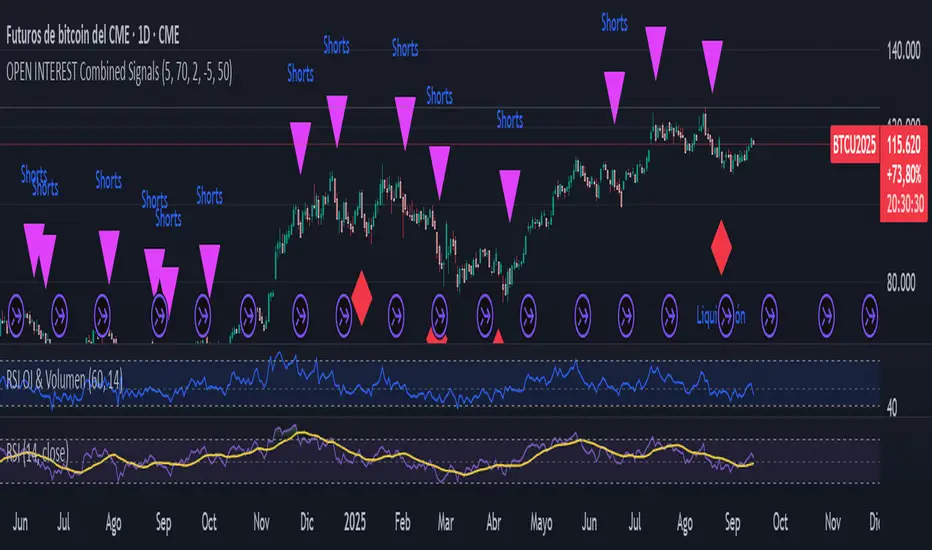
Liquidation Detector, Short and Long with Open InterestThe script analyzes three main pieces of data from each candle (or time bar): price, Open Interest (OI), and volume. It then uses that data to look for two distinct types of patterns and marks them on the chart for easy viewing.
CAN ONLY BE USED WITH STICKER BTC1! CME
Liquidation Detection:
What are you looking for? A sharp drop in Open Interest accompanied by a spike in volume.
What does it mean? This pattern indicates that a large number of positions (usually long) are being closed quickly, which can cause a sharp price drop. It's a signal of market capitulation that many traders use as a potential entry point.
Shorts Entry Detection:
What are you looking for? A price drop accompanied by an increase in Open Interest and a spike in volume.
What does it mean? This pattern shows that "new money" is entering the market to open short positions. It confirms a downtrend and suggests that the price drop has real strength behind it.
Marker: A purple triangle labeled "Shorts."
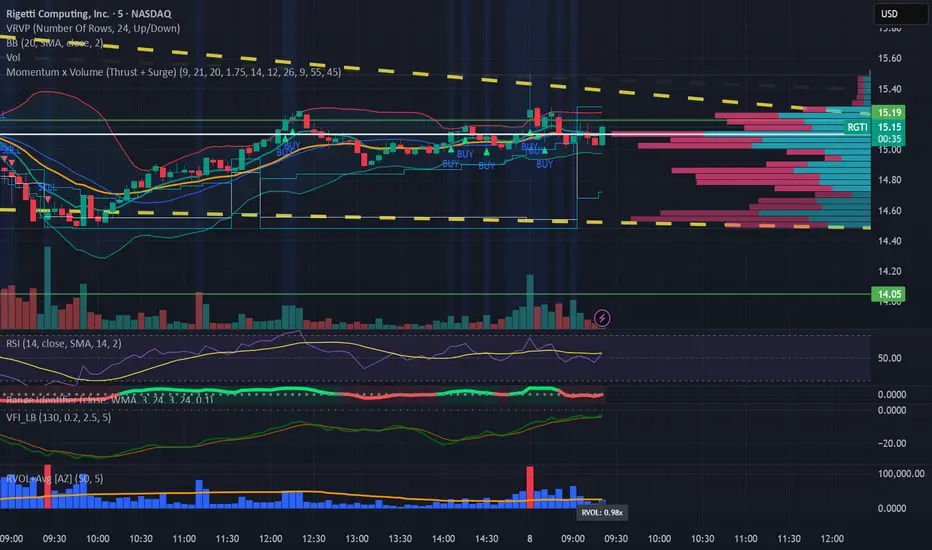
Relative Volume (RVOL) + Average Volume [AZ]The script helps you instantly see whether today’s volume is unusual compared to the past (relative volume). It’s built for breakout/fakeout filters, like the 15-minute ORB strategy you’re running.
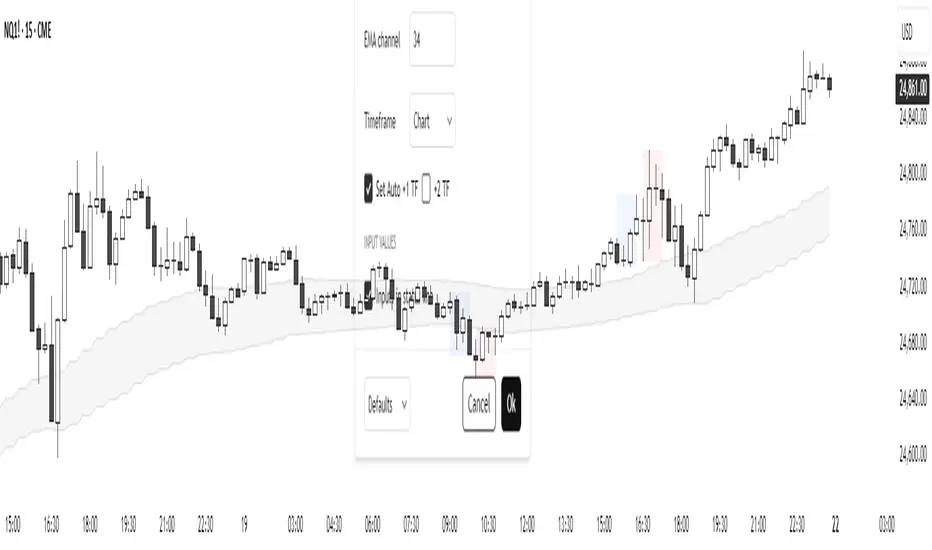
EMA channelThe script builds EMA by high and low. There is a construction by Heikin-Ashi candles, you can also use a multi-timeframe.
Basing Candles"The script identifies Basing Candles and plots a circle (white or any chosen color) at the midpoint of the candle’s body when its body is smaller than or equal to half of the candle’s total range."
"السكربت يحدد شموع Basing Candles ويرسم دائرة بيضاء أو أي لون تختاره في منتصف جسمها عندما يكون جسم الشمعة أصغر أو يساوي نصف طولها."

Leg Out Candle V2.0The Script marks candles that could be considered as a leg out of a supply/demand and are bigger than the previous ones based on the adjustable lookback value. There is also the option to adjust the threshold ob the body to wick ratio of the leg out candle. The lowest value is 50% because anything lower would be a basing candle.
